Executables
TEMPy installs a number of programs for performing common tasks. These programs are prefixed with “TEMPy.”, such as “TEMPy.smoc” and provide a convenient method of scoring fit.
TEMPy.smoc
usage: TEMPy.smoc [-h] -m MAP -p MODEL [MODEL ...]
                  [--model-colors MODEL_COLORS [MODEL_COLORS ...]]
                  [--model-names MODEL_NAMES [MODEL_NAMES ...]] -r RESOLUTION
                  --output-format OUTPUT_FORMATS [OUTPUT_FORMATS ...]
                  [--output-prefix OUTPUT_PREFIX]
                  [--plot-type PLOT_TYPES [PLOT_TYPES ...]]
                  [--plot-residue-range [PLOT_RESIDUE_RANGE [PLOT_RESIDUE_RANGE ...]]]
                  [--plot-normalize PLOT_NORMALIZE]
                  [--plot-bands [PLOT_BANDS [PLOT_BANDS ...]]]
                  [--plot-unmodelled PLOT_UNMODELLED]
                  [--smoc-window SMOC_WINDOW] [--smoc-method SMOC_METHOD]
optional arguments
- -h, --help
show this help message and exit
standard TEMPy arguments
- -m <map>, --map <map>
A EM file in MRC format. Alternatively, the accession number eg. emdb:1234
- -r <resolution>, --resolution <resolution>
Estimated resolution of EM map
model
Set additional model information
- -p <model>, --models <model>
A model file in PDB, CIF or mmCIF formats. Alternatively, the accession number eg. rcsb:1234
- --model-colors <model_colors>
Color of the models for plotting
- --model-names <model_names>
Names of the models for plotting
output
- --output-format <output_formats>
Output format: CSV, TSV, JSON, PDF, PNG
- --output-prefix <output_prefix>
Use a custom prefix for output files
plot
- --plot-type <plot_types>
Plot type: residue, violin
- --plot-residue-range <plot_residue_range>
Plot only the specified range
- --plot-normalize <plot_normalize>
Normalize the plot
- --plot-bands <plot_bands>
Draw colored bands around ranges of residues. E.g. A:10-20:00ff00 A:70-110:ff0000
- --plot-unmodelled <plot_unmodelled>
Draw colored bands around ranges of residues. E.g. A:10-20:00ff00 A:70-110:ff0000
smoc
SMOC specific parameters
- --smoc-window <smoc_window>
The window size. Should be odd.
- --smoc-method <smoc_method>
How to handle unmodelled regions
Example
To run SMOC on a model, synthase.pdb, and a map, EMD-1234.mrc.gz, with a window length of 11 and a resolution of 4.53 run:
$ TEMPy.smoc -p synthase.pdb -m EMD-1234.mrc.gz -w 11 -r 4.53
The default output of this command will be a series of files, one per chain, in tab separated format. The files are named according to the parameters. For examples, if synthase contains chains A, B and C, the following files are expected:
smoc_EMD-1234_vs_synthase_chain-A_win-11_res-4p53_contig.tsv
smoc_EMD-1234_vs_synthase_chain-B_win-11_res-4p53_contig.tsv
smoc_EMD-1234_vs_synthase_chain-C_win-11_res-4p53_contig.tsv
The output format can be changed using the ‘-f’ flag which supports ‘tsv’, ‘csv’ and ‘json’. For example, to select JSON output:
$ TEMPy.smoc -p synthase.pdb -m EMD-1234.mrc.gz -w 11 -r 4.53 --output-format json
This will result in a single JSON file with each chain stored under its own key. The parameters used to generate the score are stored under the ‘parameters’ key. The output file name would be:
smoc_EMD-1234_vs_synthase.json
Two approaches to calculating sliding windows are provided, which handle unmodelled regions differently. The new ‘contig’ based calculation creates sliding windows over contiguous residues. The old method ‘spans’ these unmodelled regions. The default method is the new ‘contig’ based approach, however this can be changed using the ‘–method’ flag.
TEMPy.loqfit
usage: TEMPy.loqfit [-h] -m MAP -p MODEL [MODEL ...]
                    [--model-colors MODEL_COLORS [MODEL_COLORS ...]]
                    [--model-names MODEL_NAMES [MODEL_NAMES ...]] -r
                    RESOLUTION [-hm1 HMAP1] [-hm2 HMAP2] --output-format
                    OUTPUT_FORMATS [OUTPUT_FORMATS ...]
                    [--output-prefix OUTPUT_PREFIX]
                    [--plot-type PLOT_TYPES [PLOT_TYPES ...]]
                    [--plot-residue-range [PLOT_RESIDUE_RANGE [PLOT_RESIDUE_RANGE ...]]]
                    [--plot-normalize PLOT_NORMALIZE]
                    [--plot-bands [PLOT_BANDS [PLOT_BANDS ...]]]
                    [--plot-unmodelled PLOT_UNMODELLED]
                    [--max-loqfit-score MAX_LOQFIT_SCORE]
optional arguments
- -h, --help
show this help message and exit
standard TEMPy arguments
- -m <map>, --map <map>
A EM file in MRC format. Alternatively, the accession number eg. emdb:1234
- -r <resolution>, --resolution <resolution>
Estimated resolution of EM map
- -hm1 <hmap1>, --half-map-1 <hmap1>
A EM half map file in MRC format. Alternatively, the accession number eg. emdb:1234
- -hm2 <hmap2>, --half-map-2 <hmap2>
A EM half map file in MRC format. Alternatively, the accession number eg. emdb:1234
model
Set additional model information
- -p <model>, --models <model>
A model file in PDB, CIF or mmCIF formats. Alternatively, the accession number eg. rcsb:1234
- --model-colors <model_colors>
Color of the models for plotting
- --model-names <model_names>
Names of the models for plotting
output
- --output-format <output_formats>
Output format: CSV, TSV, JSON, PDF, PNG
- --output-prefix <output_prefix>
Use a custom prefix for output files
plot
- --plot-type <plot_types>
Plot type: residue, violin
- --plot-residue-range <plot_residue_range>
Plot only the specified range
- --plot-normalize <plot_normalize>
Normalize the plot
- --plot-bands <plot_bands>
Draw colored bands around ranges of residues. E.g. A:10-20:00ff00 A:70-110:ff0000
- --plot-unmodelled <plot_unmodelled>
Draw colored bands around ranges of residues. E.g. A:10-20:00ff00 A:70-110:ff0000
LoQFit
- --max-loqfit-score <max_loqfit_score>
Maximum LoQFit value to be plotted
Example
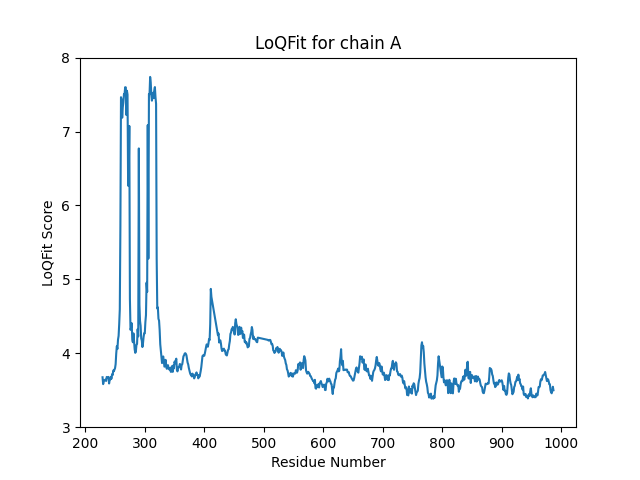
To run LoQFit on a model, 7kx7.pdb - which is a PIWI protein from the organism Ephydatia fluviatilis. 7kx7 has a corresponding cryo EM map deposited in the EMDB at the ID 23061. We can grab these files from the online repositories and score the model with LoQFit by running:
$ TEMPy.loqfit -p rcsb:7kx7 -m emdb:23061 -r 4.53
The default output of this command will be a series of files, one per chain, in tab separated format. The files are named according to the parameters. For examples, as 7kx7 contains chains A and B, the following files are expected:
loqfit_emdb_23061_vs_rcsb_7kx7_chainA.tsv
loqfit_emdb_23061_vs_rcsb_7kx7_chainA.tsv
As with the smoc script, the output format can be changed using the ‘-f’ flag which supports ‘tsv’, ‘csv’ and ‘json’. For example, to select JSON output:
$ TEMPy.loqfit -p rcsb:7kx7 -m emdb:23061 -r 4.53 --output-format json
This will result in a single JSON file with each chain stored under its own key. The parameters used to generate the score are stored under the ‘parameters’ key. The output file name would be:
loqfit_emdb_23061_vs_rcsb_7kx7.json
The script will also write out a plot of the LoQFit score for each chain in the model. These can be saved as either vector graphics ‘.svg’ files or as png images by changing the ‘–output-format’ flag. E.g. to save the LoQFit plots for the synthase example as png files, run:
$ TEMPy.loqfit -p rcsb:7kx7 -m emdb:23061 -r 4.53 --output-format png
This produces this plot for chain A:
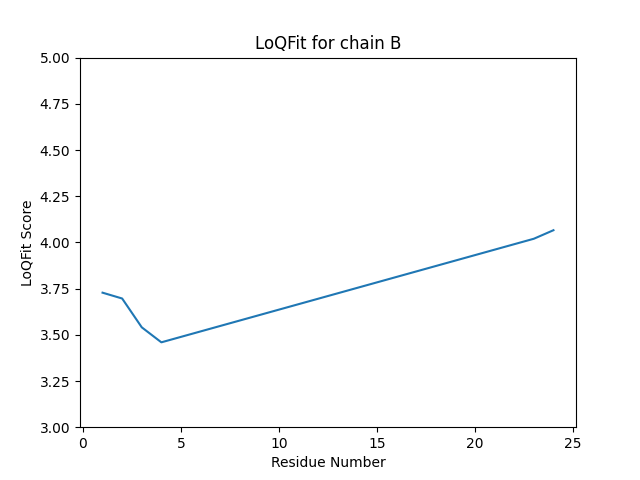
And this (slightly silly) plot for chain B, which has just a few modelled residues:
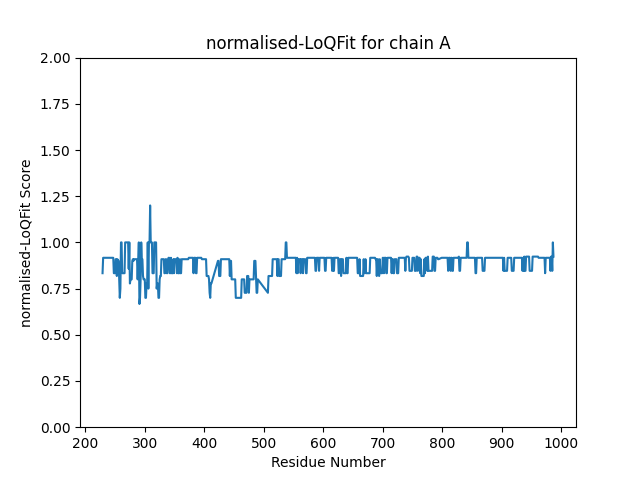
Finally, the LoQFit score can be normalised using the local resolution of the EM-map. TEMPy needs the half-maps to calculate the local resolution and these can be supplied with the ‘-hm1’ and ‘-hm2’ flags. If both half maps are supplied, the normalised LoQFit score is automatically calculated. We can get the half-maps from the EMDB, assuming they are deposited. So, to calculate the normalised LoQFit we can run:
$ TEMPy.loqfit -p rcsb:7kx7 -m emdb:23061 -r 4.53 --output-format png -hm1 emdb:23061 -hm2 emdb:23061
Which gives us this plot for chain A:
TEMPy.gamma
usage: TEMPy.gamma [-h] -p MODEL
                   [--model-colors MODEL_COLORS [MODEL_COLORS ...]]
                   [--model-names MODEL_NAMES [MODEL_NAMES ...]] -m MAP -r
                   RESOLUTION [--gamma-pop-size POP_SIZE]
                   [--gamma-num-gens NUM_GENS] [--gamma-num-gas NUM_GAS]
                   [--gamma-gof GOF] [--gamma-num-cpus NUM_CPUS] --output-dir
                   OUTPUT_DIR --output-file OUTPUT_FILE [--output-pdbsnap]
                   [--gamma-seed-file /path/to/seedpoints_file]
                   [--gamma-mut-rate MUT_RATE] [--gamma-xover-rate XOVER_RATE]
                   [--gamma-offset-mag OFFSET_MAG]
optional arguments
- -h, --help
show this help message and exit
standard TEMPy arguments
- -m <map>, --map <map>
A EM file in MRC format. Alternatively, the accession number eg. emdb:1234
- -r <resolution>, --resolution <resolution>
Estimated resolution of EM map
model
Set additional model information
- -p <model>, --models <model>
A model file in PDB, CIF or mmCIF formats. Alternatively, the accession number eg. rcsb:1234
- --model-colors <model_colors>
Color of the models for plotting
- --model-names <model_names>
Names of the models for plotting
gamma
- --gamma-pop-size <pop_size>
Number population members in each generation (default = 160)
- --gamma-num-gens <num_gens>
Number of generations in the GA (default = 100)
- --gamma-num-gas <num_gas>
Number of GA solutions to generate (default = 1)
- --gamma-gof <gof>
Goodness-of-fit score to use. (1) - Mutual information score, (2) - CCC (default = MI score)
- --gamma-num-cpus <num_cpus>
Number of CPUs to use (default = 1)
- --gamma-seed-file </path/to/seedpoints_file>
Supply a PDB formated file containing the coordinate to use as initial VQ points (By default the VQ points will be generated from the input density map)
- --gamma-mut-rate <mut_rate>
Mutation rate (default = 0.02). This is a advanced setting for expert user
- --gamma-xover-rate <xover_rate>
Crossover rate (default = 0.8). This is a advanced setting for expert user
- --gamma-offset-mag <offset_mag>
Magnitude of the displacement used while applying transational mutation (default set 0.0 will calculate moffset value from the VQ point distances). This is a advanced setting for expert user
output
- --output-dir <output_dir>
Name of the output directory to store results - default is to create a new folder in the directory of the input map
- --output-file <output_file>
Prefix name of the predicted fits (default is set to the name of the input PDB file name)
- --output-pdbsnap
Write all the members (PDB fits) in every GA population for every generation. By default this option is off.