Quick start
This Quickstart guide will run you through installing TEMPy2 and scoring models and fitting assemblies with SMOC and gamma-TEMPy.
Getting TEMPy
TEMPy can be installed using the pip package manager. In a shell run:
$ pip install BioTEMPy==2.0
Scoring a structure with SMOC
The TEMPy package comes with a number of useful for programs. The TEMPy.smoc tool generates residue level model/map correlation scores.
To generate SMOC scores for the model with ID 5fj8 from the RCSB database and its associated cryo-EM map (3178 from the EMDB), we can run:
$ TEMPy.smoc -p rcsb:5fj8 \      # Use the 5fj8 model from RCSB
             -m emdb:3178 \      # Use the 3178 map from EMDB
             -r 3.9 \            # The resolution
             --output-format png # Generate png images
This will generate a series of plots in PNG format, one per chain such as the plot below.
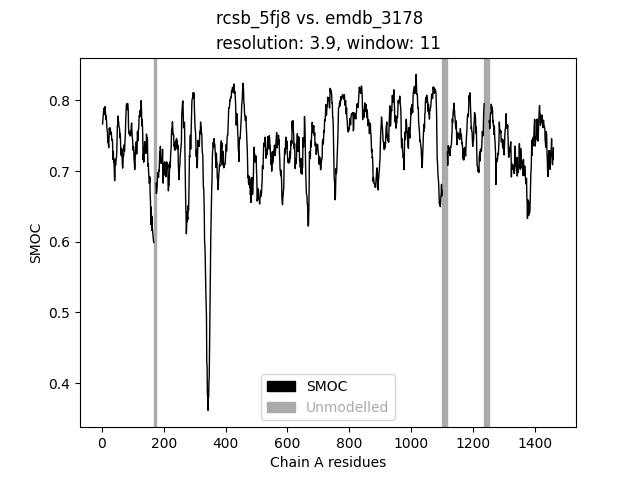
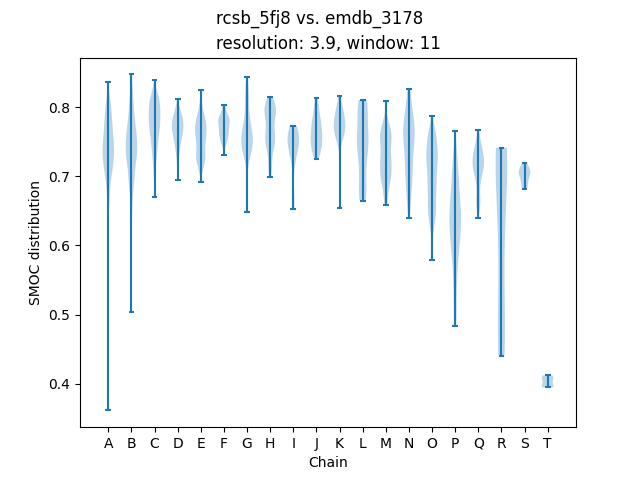
The –plot-type argument allows you to choose two different plot types. The default is the “residue” plot as shown above, where each chains SMOC score is in a separate file. The “violin” option shows the distribution of each chains residue in a single file.
$ TEMPy.smoc -p rcsb:5fj8 \              # Use the 5fj8 model from RCSB
             -m emdb:3178 \              # Use the 3178 map from EMDB
             -r 3.9 \                    # The resolution
             --output-format png         # Generate png images
             --plot-type residue violin  # Plot residue plots and a violin plot
It is possible to generate tabulated data in either TSV or CSV format or JSON formatted output. If you’d like to learn how develop Python programs which use the SMOC scrore, checkout the Scoring functions guide.
For more details on TEMPy.smoc and its supported options see Executables
Scoring chains with LoQFit
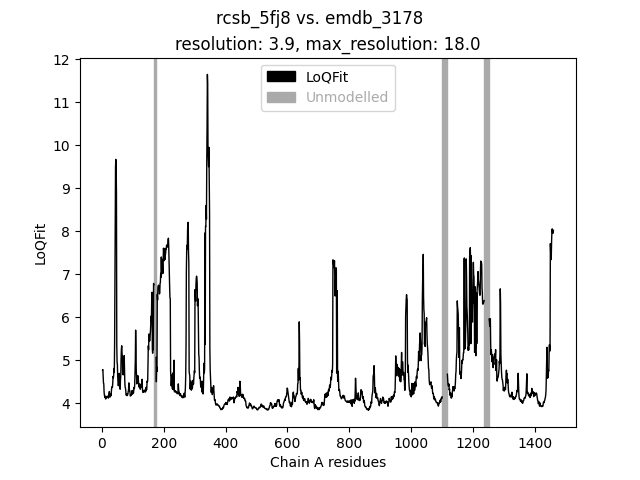
Another similar scoring function is LoQFit, which evaluates the model/map correlation in fourier space.
The TEMPy.loqfit script will compute the loqfit score for each residue in a protien.
$ TEMPy.loqfit -p rcsb:5fj8 \      # Use the 5fj8 model from RCSB
               -m emdb:3178 \      # Use the 3178 map from EMDB
               -r 3.9 \            # The resolution
               --output-format png # Generate csv file
This script will generate a plot of the LoQFit score for each chain, such as the plot below for chain A.
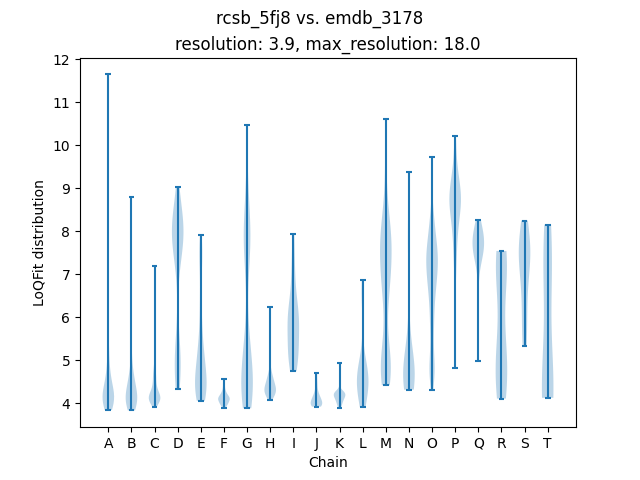
Like the SMOC plot, the distribution of resolutions for all chains can be viewed in a single plot by setting the –plot-type to “violin”.
$ TEMPy.loqfit -p rcsb:5fj8 \              # Use the 5fj8 model from RCSB
               -m emdb:3178 \              # Use the 3178 map from EMDB
               -r 3.9 \                    # The resolution
               --output-format png         # Generate csv file
               --plot-type residues violin # Plot residue plots and a violin plot
Scoring chains with SCCC
The SCCC (Segmented Cross-Correlation Coefficient) computes the cross-correlation to on arbitrary segments of a protein.
The TEMPy.SCCC script will compute them on each chain.
$ TEMPy.sccc -p rcsb:5fj8 \      # Use the 5fj8 model from RCSB
             -m emdb:3178 \      # Use the 3178 map from EMDB
             -r 3.9 \            # The resolution
             --output-format csv # Generate csv file
Fitting an assembly with gamma-TEMPY
To develop your own python scripts checkout the Guides and Python API Reference.